$ git clone git://repo.or.cz/pyplotsuite.git


The PyPlotSuite project, beside its bright name, aims to provide immediate, easy-to-use, multiplatform, GUI tools to display, analyze and create publication-quality 2D plots of 1D data series, images, 2D arrays (under the GPL licence).
PyPlotSuite is a set of graphical tools to quick visualize and explore/analyze mono-dimensional and bi-dimensional data. The plot created can be saved in a variety of image formats to produce publication quality graphs.
At the moment the project is composed by two little stand alone applications: ImageAnalyzer and Plotfile2 (I know I could have chose better names ;-)).
ImageAnalyzer is focused towards images (or any 2D data, such as float arrays) visualization, analysis, and measurement. Plotfile2 focus is toward simple data series visualization, with the possibility to quick modify many plot characteristics. Both applications can save the result on a multitude of image file formats (png, eps, jpeg, pdf, and more). In future this two application will be more integrated.
PyPlotSuite is written in python, using the GTK gui toolkit (through the python binding pygtk, and using Glade-2 to layout the windows). All plots are created with the great Matplotlib python 2D graphic library. Matplotlib is such a good tool that the PyPlotSuite applications are only tiny wrapper around Matplotlib functionality. Also some Numpy functionality are used both through Matplotlib (which requires Numpy) and both directly.
More information (such as TODOs) on the README file.
Fixed some small bugs presents in alpha9
Show absolute path in "Image Properties"
A trivial numarray.ndimage fix
"Add by" and "Multiply by" little improvements
New release of PyPlotSuite with a lot of new features and bug-fix especially in ImageAnalyzer. Most notably, a save-file feature and a tool to calculate integrals over an image. Follows the changelog:
New "Sum by" and "Multiply by" functions added.
New Image Properties dialog which shows file name, size, max and min values and coordinates, and other values (mean, variance, median, …)
Histogram plot speedups (thanks to the use of ndimage.measurements) and added selectable number of bins.
Added tools to graphically set parameters to calculate integral of a peak in the image. The integral domain is selected by the pixels inside a circle that are above a threshold value. The circle center is selectable via mouse click on the image. The pixels outside the circle that are below the threshold are used to calculate the offset of the image. The results can be saved to a text file.
Added "Save file" to save modified images as arrays in pickle format.
Added a virtual binning feature (similar of the binning feature of some CCD). It reduces the image resolution building each pixel as the sum of the values of the pixel in a rectangle. Note that this is not a boxcar filter (and IIRC is not even a linear filter).
Another bugfix from David Trémouilles (about dialog close button work on Mac) Thanks ;).
Added multiplatform installer using distutils. Now to install the pyplotsuite system-wide just do "python setup.py install" form the source tree with administrative privileges.
Various bug-fixes thanks to David Trémouilles' bug reports and patches (now the open dialog remebers the last dir).
scipy.filters is now only optional to run ImageAnalyzer
ImageAnalyzer: Allow to change aspect ratio for images in ImageAnalyzer (via the pixel dimesion dialog)
ImageAnalyzer: Zemax file format loading fixes and autodetection improvements.
Only Plotfile2 changes in this release. Various speed-up and code optimization, and the support for changing also the color for all line-plot elements.
As always testing/hacking is more than welcome.
A new version (0.1-alpha6) of PyPlotSuite is avalilable.
This is the first version of PyPlotSuite released as a single tarball. It includes both ImageAnalyzer and Plotfile2.
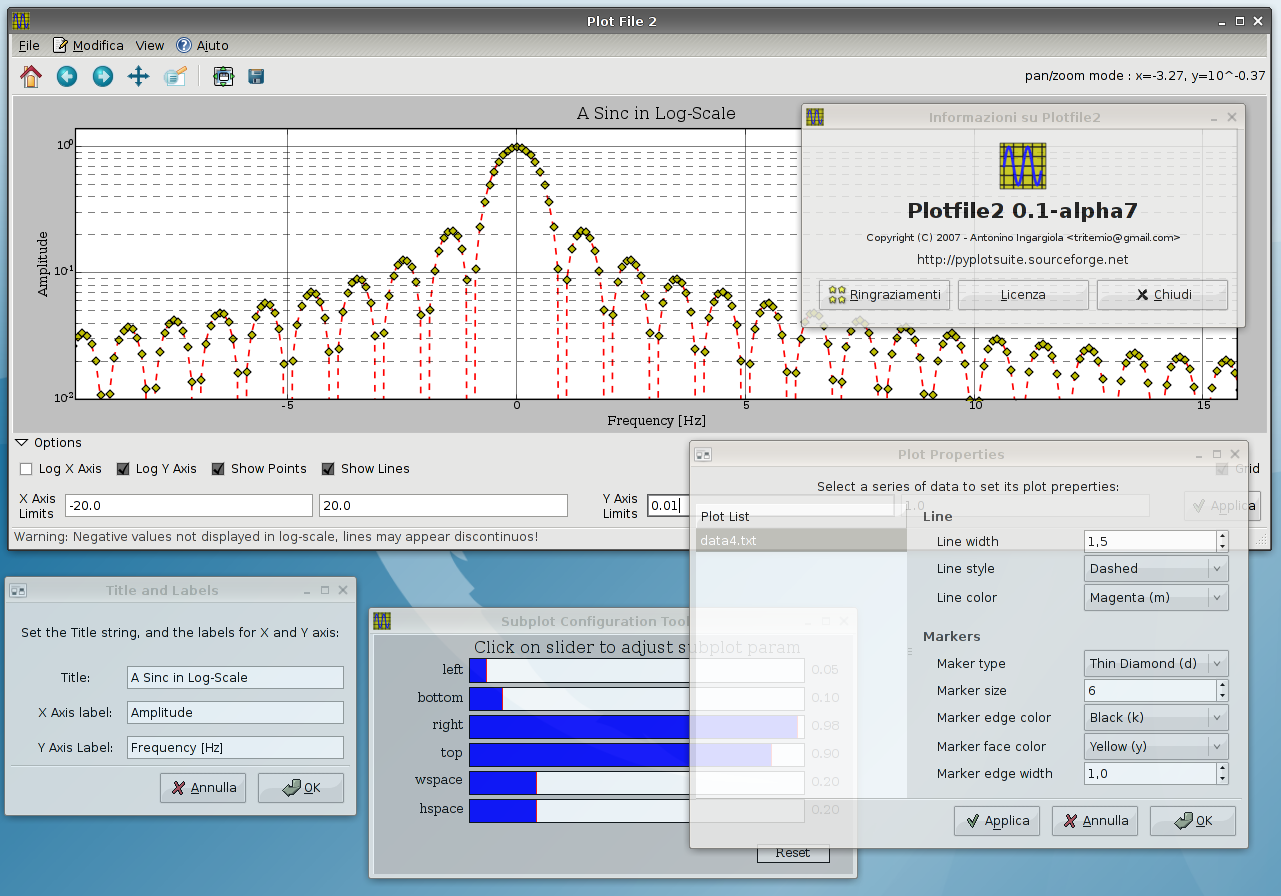
A new plot property dialog in Plotfile2 allows to change many plot parameters (line style and width, marker style and size). There's also the GUI for changing the colors of the various plot elements but this functions is not implemented in the underlying code yet.
Since version 0.1-alpha6 PyplotSuite is released as a single tarball containing both ImageAnalyzer and Plotfile2.
You can download the tarballs from SourceForge download page:
The applications should be quite usable, but there are surely bugs (please report if you find some) and missing features.
Your are encouraged to use the program, read the source and hack the code at your own pleasure. Also bug-reports, feature requests and patches are more than welcome.
Currently, I'm the only PyPlotSuite developer. I you want join the team contact me via mail.
The development tree of PyPlotSuite is hosted on a git repository. To download the latest development version just install git and type:
$ git clone git://repo.or.cz/pyplotsuite.git
Now you have a complete working version of PyPlotSuite to test/hack on. If git does not work on your OS (I think only windows is affected) look at bazar that is a multiplatform SCM written in python. Bazar has a plugin to read git repository.
Here it is some screenshots of Image Analyzer and Plotfile2, just for whetting your appetite:
Python: a dynamic object-oriented programming language.
Numpy: The fundamental package needed for numerical computing with Python. It is the successor (and unifier) of all the old projects (Numeric and Numarray) for python numerical computing.
SciPy: Many modules that were not specific to Numpy are gathered under the broader project SciPy:
MatPlotLib: A multiplatform 2D plotting library and interactive environment which produces publication quality figures in a variety of hard-copy formats. Matplotlib is written in python.
Python Imaging Library (PIL).
GTK+ a multi-platform toolkit for creating graphical user interfaces.
PyGTK GTK+ for Python.
QtiPlot: Data analysis and visualization
Veusz: A scientific plotting package designed to produce publication-ready Postscript output.
IPython: Advanced python shell for interactive and parallel computing
TraitsUI: a module that allows automatic generation of WxPython dialogs to edit the properties of objects.
PyPlotSuite project is hosted by SourceForge.net.
The git repository is hosted by repo.or.cz